Market Overview
Indices, sectors, and macro at a glance — see what's moving the market before you dig in.
Built for advisors and wealth managers who have to defend every position. Optifine.ai scores every stock and fund on three dimensions — Fundamental, Momentum, and Quantitative — so you can screen, compare, and justify an allocation in minutes.
Institutional research. Built for how advisors work. Client-ready answers.
Indices, sectors, and macro at a glance — see what's moving the market before you dig in.
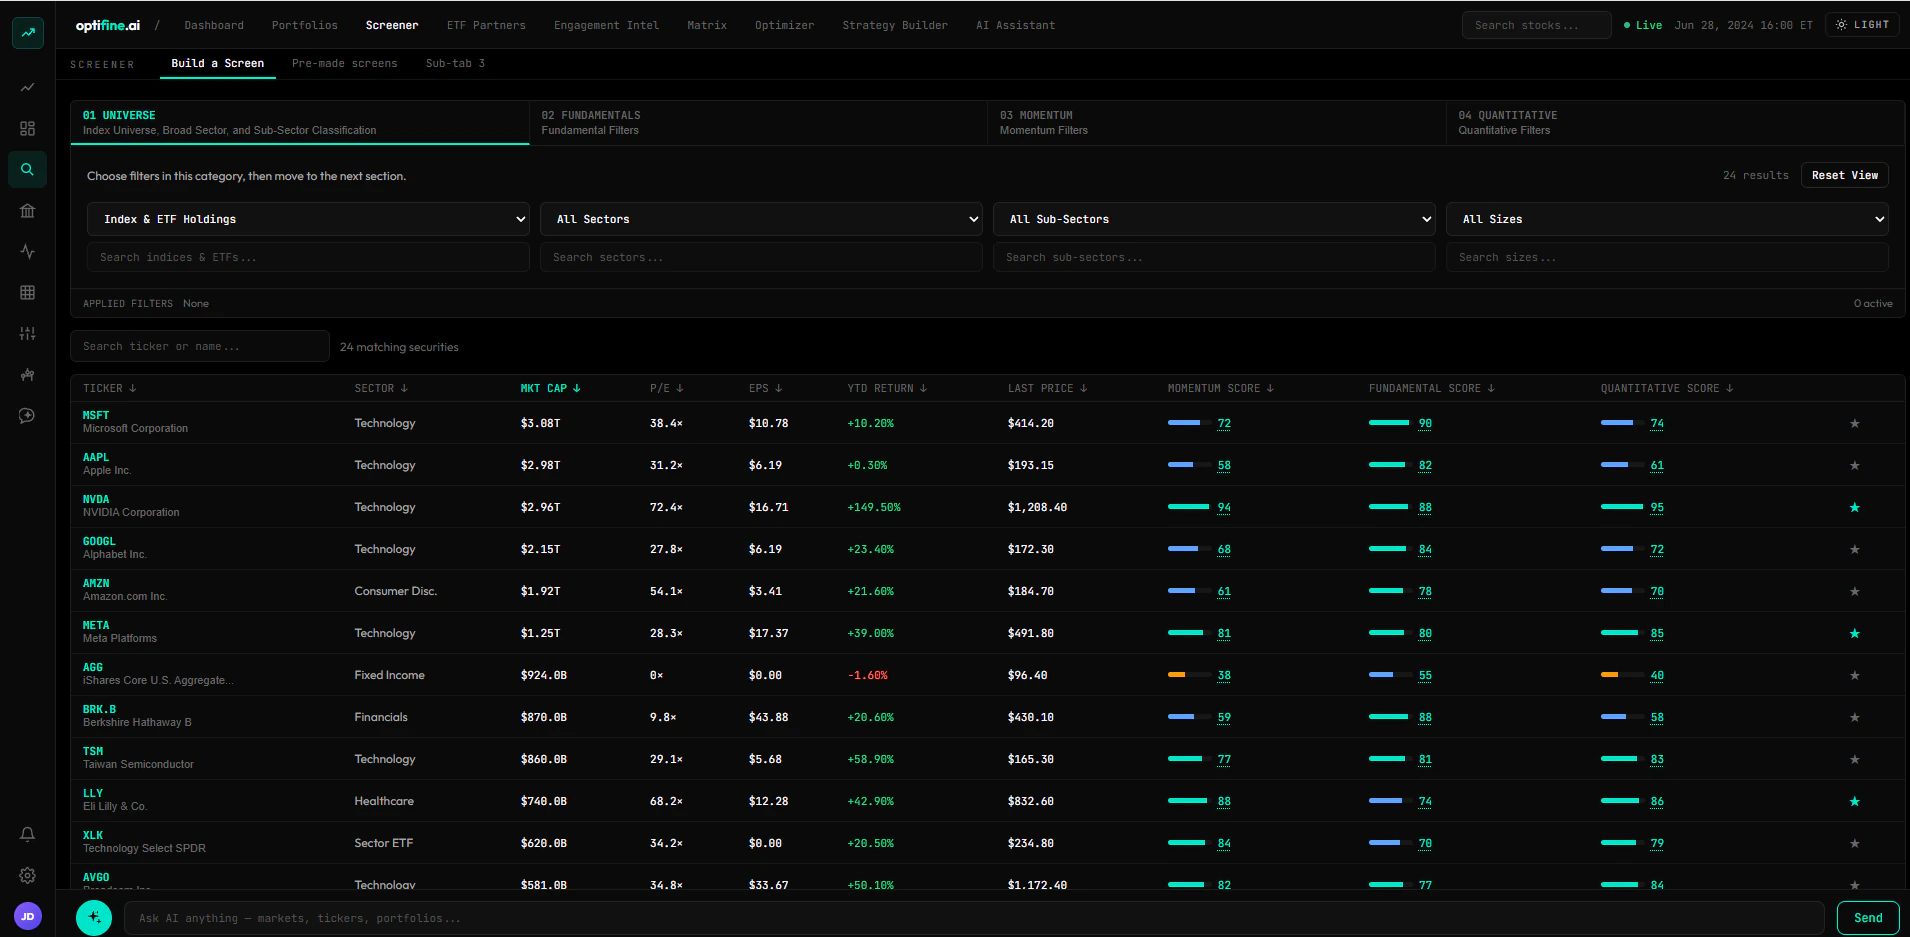
Slice the whole market by valuation, growth, momentum, and factor exposure to find your next idea.
Track holdings, live P&L, and portfolio risk — beta, exposure, and returns — in views you control.
A transparent score for every stock and fund, across three lenses: fundamentals, momentum, and quantitative.
Turn the scores into rules: pick a universe, rank it, set exclusions and weights, then backtest before committing a dollar.
Ask in plain English. Every figure is pulled from real data and computation — the AI narrates, it doesn't guess.
Most AI tools happily invent a financial ratio. Ours can't. Every figure the assistant shows is computed from stored market data — the language model only explains what the numbers mean. No hallucinated metrics. Ever.
Start from the whole market, narrow to the names that fit your criteria, and dig into scores and analytics on each one.
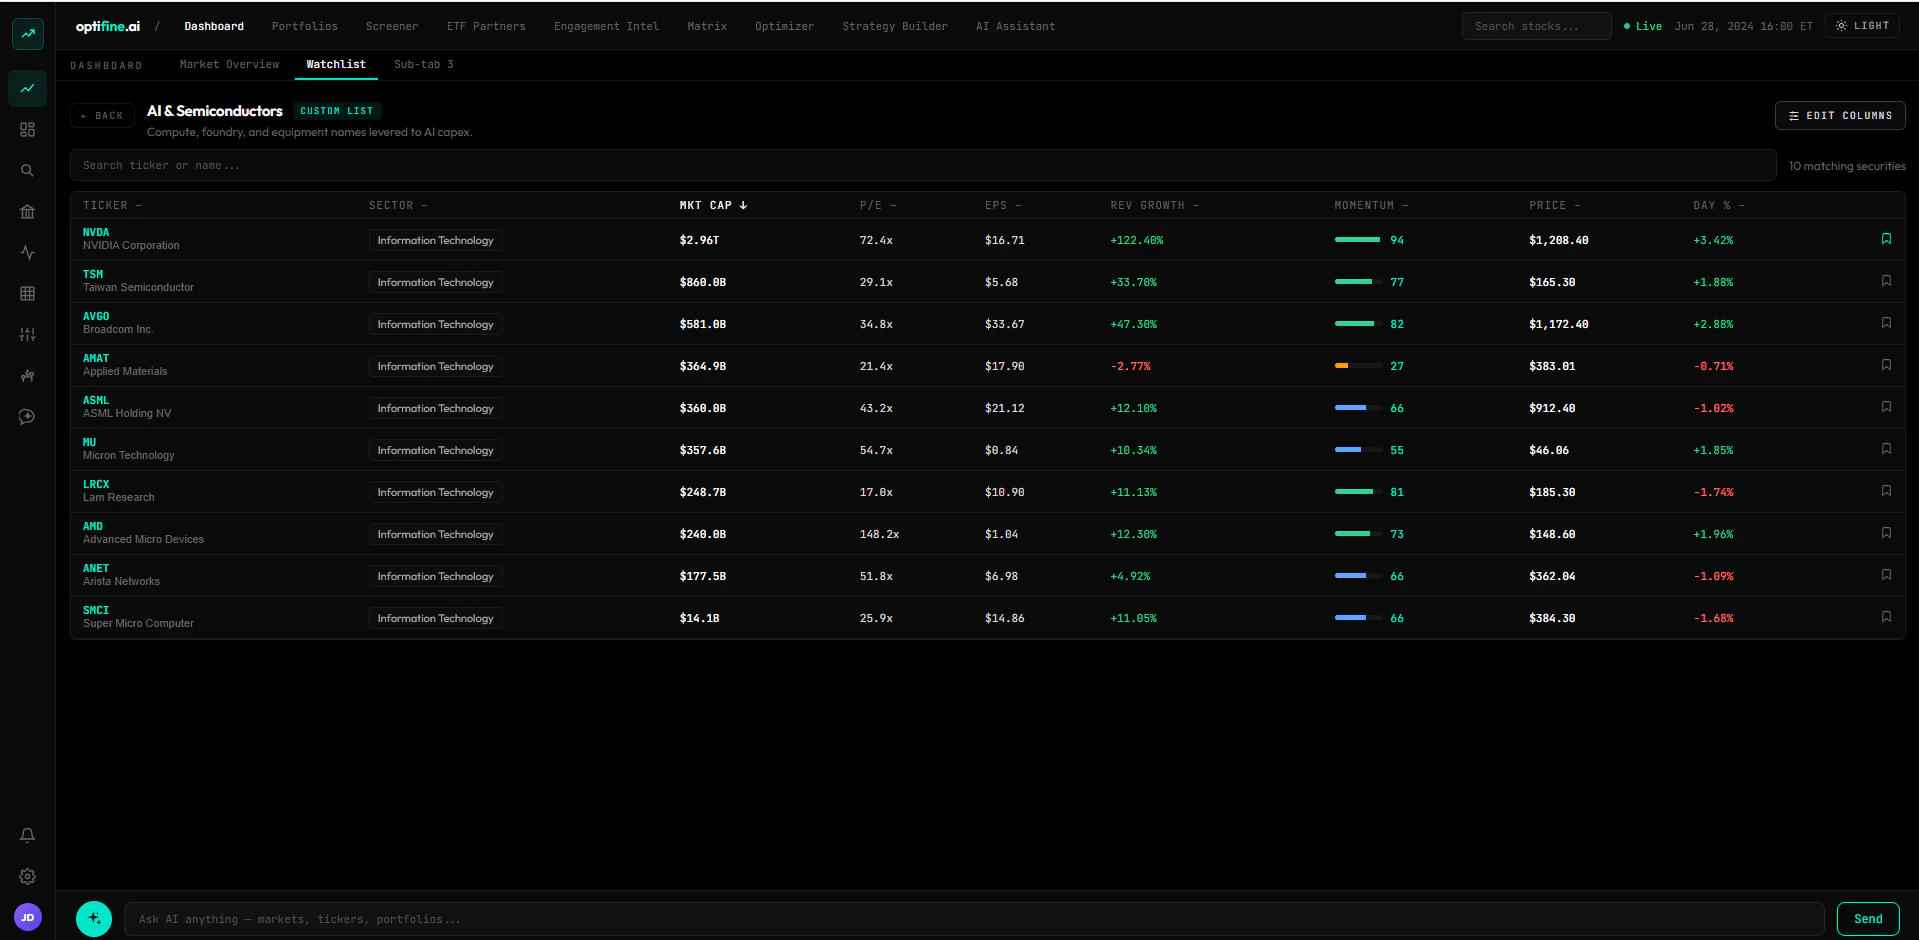
Build a basket in the Strategy Builder and see how each name has held up head-to-head against its peers.
Size the positions, commit them to a portfolio, and track performance, risk, and daily changes over time.
Most scores look at one slice of an asset. Ours look at the whole thing. Our methodology reads fundamentals, momentum, and quantitative behavior together, across the full universe of stocks and funds. A score reflects what is actually moving an asset, not one narrow factor that happens to be in favor.
Three independent scores — Fundamental, Momentum, and Quantitative — each computed from the same published inputs on a 0–100 scale, then combined into one composite. Nothing is hand-adjusted, and every factor a score rests on is listed below.
Answers one question: is this a good business at a defensible price? Built from reported financials and consensus estimates, scored against the company's own sector so a software name is never penalized for a bank's balance sheet.
Ranks demand rather than value: how an asset is performing against the market, against its peers, and against its own trend — with weaker weight on raw return and heavier weight on relative strength that has persisted.
Funds are scored on look-through holdings: the fund's Momentum Score is the weighted average of its constituents' scores.
Looks at how the investment has actually behaved: what it is really exposed to, how much risk it took to earn its return, and whether that behavior held up in both good and bad markets.
Funds are scored on look-through holdings: the fund's Quantitative Score is the weighted average of its constituents' scores.